Ivyware/Chartboard
A separate product, on the same kernel
The whole board,
one workspace.
Chartboard is a traditional Windows application built around a workspace: charts, data, portfolios, models and scripts, all held together and all serialised. Left-click an item for its properties, right-click it for what you can do to it. That's the entire interaction model.
What it is
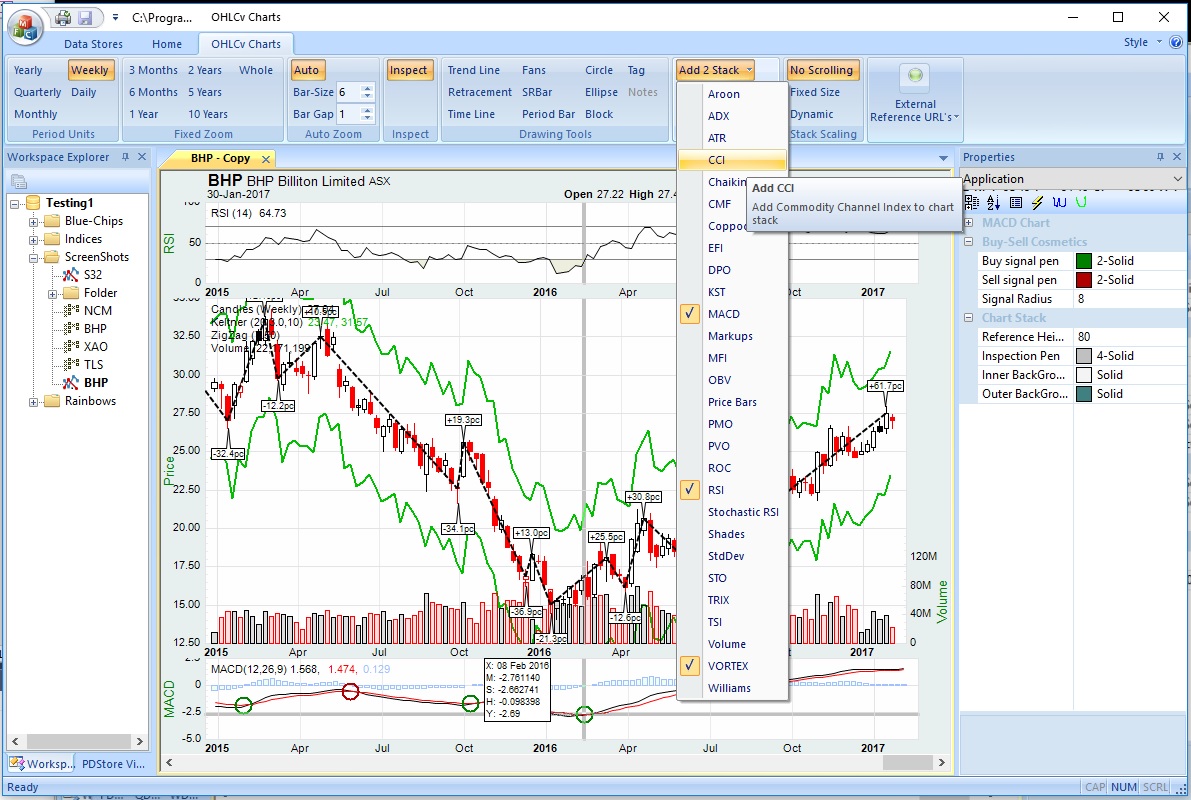
OverviewChartboard is comprehensive technical analysis, charting, portfolio, modelling and Python advisor software, designed as a traditional Windows application centred on the concept of a workspace.
- Ribbon UI centric workspace. The interface revolves around a ribbon-based UI with dynamic content and context, navigable by keyboard and mouse alike.
- Multiple tabbed views across every chart, data and scripting category.
- Explorer bars for managing chart, data, portfolio, modelling and Python script collections — with toolbars and context menus that behave like Windows File Explorer.
- Context-sensitive properties grid and menus. Both adapt to what you have selected, so configuration rarely needs a dialog at all.
- Automatic and manual scaling per chart.
- Customised reference resources. Context-sensitive reference URLs, blogs, stock home pages, statistics and tutorial videos, opened internally in a tab or externally in your browser.
- Docking support so the workspace lays out the way you want it.
- Import and export of charts, data and mark-ups, plus copy-paste of content between them.
- In-memory paged database. An internal store for efficient data management — no SQL server required for deployment.
- Mark-ups, drawing tools and cursors.
- Regression curve fitting — linear, polynomial, exponential, and Sornette's LPPL (log periodic power law) bubbles.
- Portfolio integration, trade modelling, robo signals, and market replay with stepping and rewind.
- Python 3.11 advisor and scanning scripts with Chartboard extensions, including AI integration via scripts. Synthetic charts are generated automatically from a scan script's chart and overlay prerequisites.
- OHLC and Point & Figure chart categories, plus template charts onto which variable stock data can simply be dragged and dropped.
- Diagnostics console for developing and debugging Python scripts, with both conventional and Python cursors for exposing chart data.
Charts present, in the aggregate, an enormous number of configurable properties, settings and format variants. All of it is reachable by point and click, because everything routes through the ribbon, the context menus and the properties grid rather than through configuration dialogs.
Explore
Six areasCharts
Charts & indicators
Period units, chart categories, the OHLC stack, twenty-odd overlays, thirty-odd oscillators, mark-ups and drawing tools.
Read more →Data
Data sources
The CBDatastore, end-of-day and bulk imports, short-selling data, and the supported third-party file formats.
Read more →Python
Advisor scripts
Embedded Python 3.11 with duplex access back into the chart stack, extension classes and a diagnostics console.
Read more →Python
Stock scanning
Serialised scan definitions, synthetic charts per stock, tabulated results and one-click drill-down to the chart.
Read more →Modelling
Trade modelling
Model trades from scripts or by hand, annotate them on the chart, and keep them separate from portfolio positions.
Read more →Portfolio
Portfolio
Real positions and dividend payments, marked up on any chart in the stack and available to scripts.
Read more →Getting started
Install & first runRequirements
Windows 10 or later. Everything else Chartboard needs is in the installer, including the Python runtime and its extensions.
- Chartboard does not require IP connections, firewall privileges or anything comparable. It works entirely against your local datastore.
- Chartboard should not be run elevated, and has no need to be. If it detects administrator privileges it disables Python scripting — which is the usual explanation when advisor and scanner scripts silently refuse to run.
- Python
.pyw, advisor.pyaand scanner.pysscripts should only be accepted and run from sources you trust. They execute with your privileges and can reach out of Chartboard.
Starting the application
- Double-click the Chartboard desktop icon. Alternatively, from Windows Explorer, run
Chartboard.exefrom the install directoryC:\Program Files\Chartboard\bin. - Click the Chartboard application icon in the top-left corner and choose Open…. Sample workspace files are in
C:\Program Files\Chartboard\WS&Attachments. - Attach a data store to the workspace via Ribbon Bar → WS Attachments → Datastore → Attach…
To start fresh instead, choose New… from the same application menu, pick a name and destination, then add folders and charts through the explorer buttons and context menus. A new or existing datastore then needs attaching via Ribbon Bar → WS Attachments → Datastore Panel → New… and Attach… respectively.
Double-clicking any file with the .Msgraws extension in Windows Explorer performs that whole sequence and opens the selected workspace. A shortcut can also be created with the workspace name as a command argument.
Multiple instances of Chartboard may run on one machine. However, a workspace may not be shared concurrently — not on the same machine, and not across a network.
Working in it
- Numerous tab-switchable charts may be active at once.
- Multiple dockable explorer bars organise charts and data stores; bar operations run through dedicated toolbars and context menus.
- Charts support yearly, quarterly, monthly, weekly and daily period intervals, each with unique serialisation. A chart can be restored completely to its previously serialised state, and each chart maintains its own state transparently.
- Extensive copy–paste exists for both object transfer and format painting. An existing chart can be turned into a template by a copy–paste sequence.
- Context-sensitive grid properties are exposed for whatever application item or chart object is selected.
If in doubt: left-click an item for its grid properties, right-click it for its context menu.
Underneath
P2PmsgcoreChartboard's chart engine, its paged datastore and its embedded Python interpreter are separate components that talk to one another over the P2Pmsgcore message kernel. That is why a Python script can reach back into a live chart stack, and why the diagnostics console can watch it happen.