Ivyware Chartboard Screenshots The workspace in use Melbourne, AU
Ivyware

Ivyware/Chartboard/Screenshots

Screenshots

The workspace, in use

Ribbon bar across the top, dockable explorer bars down the side, tabbed chart views in the middle, and a properties grid that follows whatever you last clicked. Select any image for the full-size version.
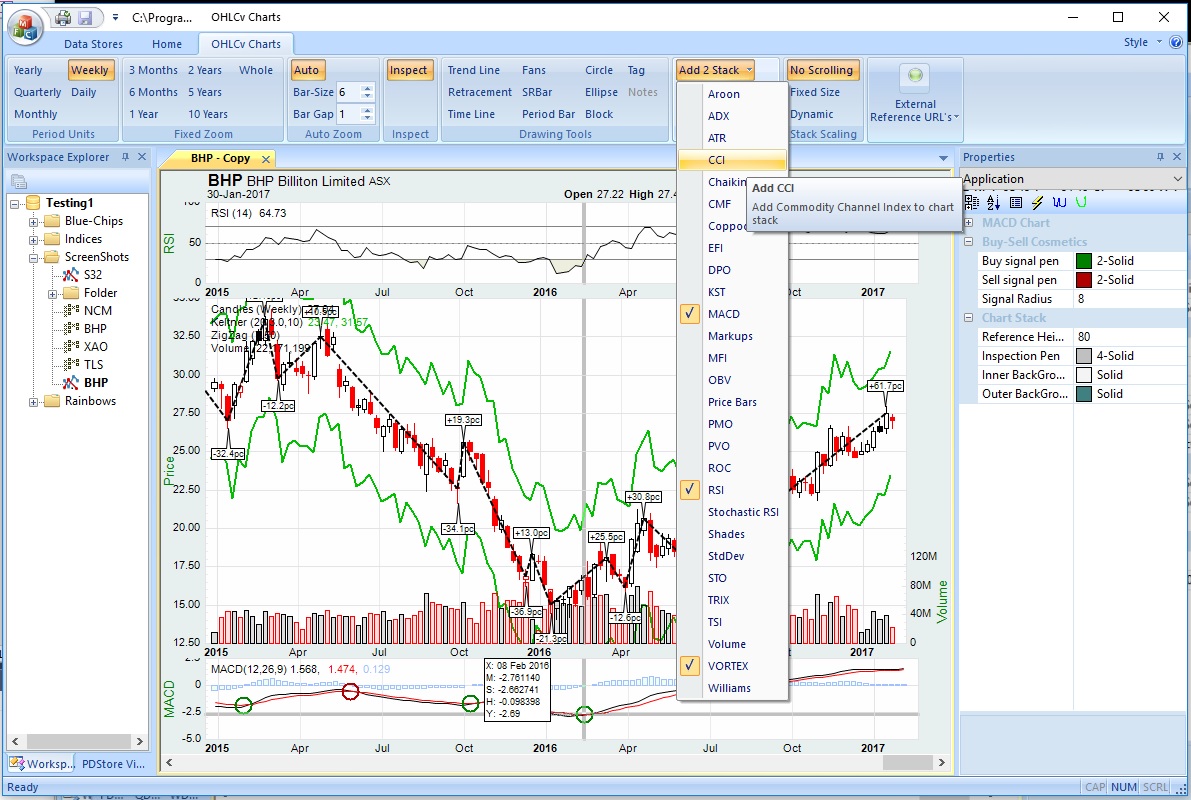
The Chartboard workspace arranged for OHLC chart development, with explorer bars, a tabbed chart view and the properties grid.
OHLC workspaceWorkspace for OHLC chart development, dynamic configuration, persistence and exchange.
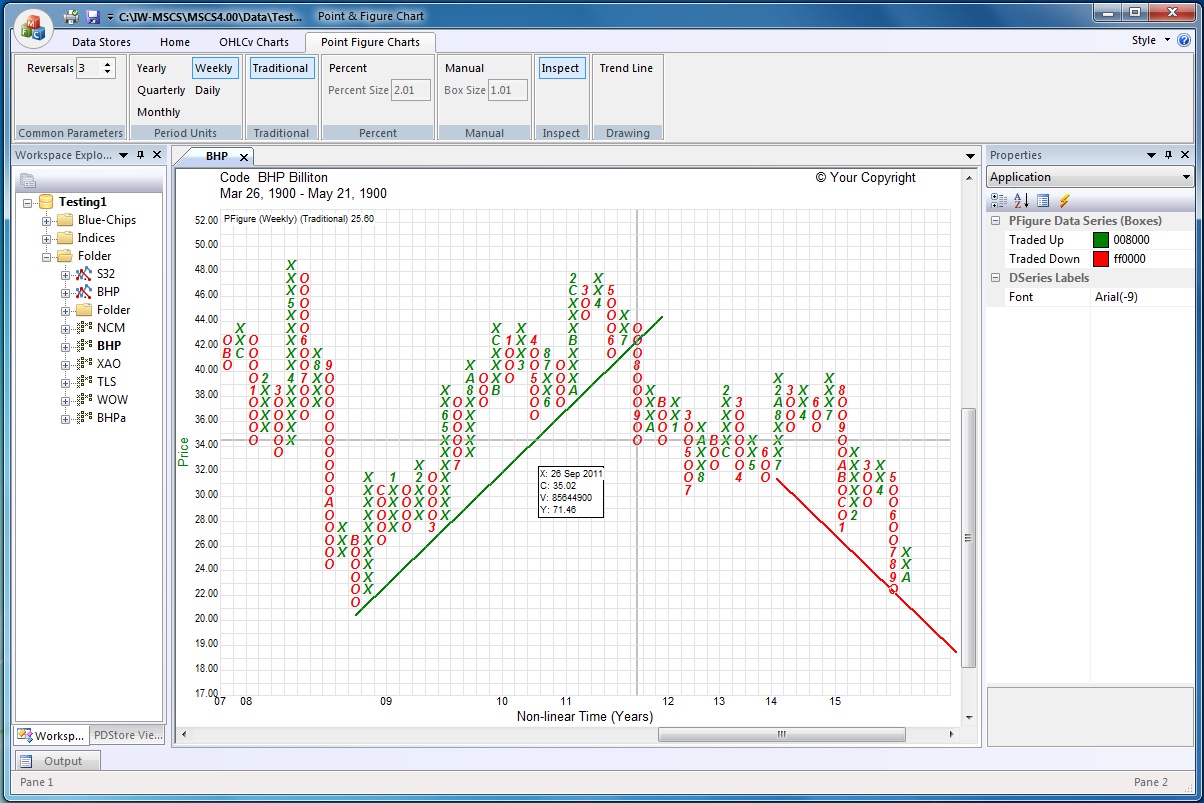
The Chartboard workspace arranged for Point and Figure chart development.
Point & Figure workspaceWorkspace for Point & Figure chart development, dynamic configuration, persistence and exchange.
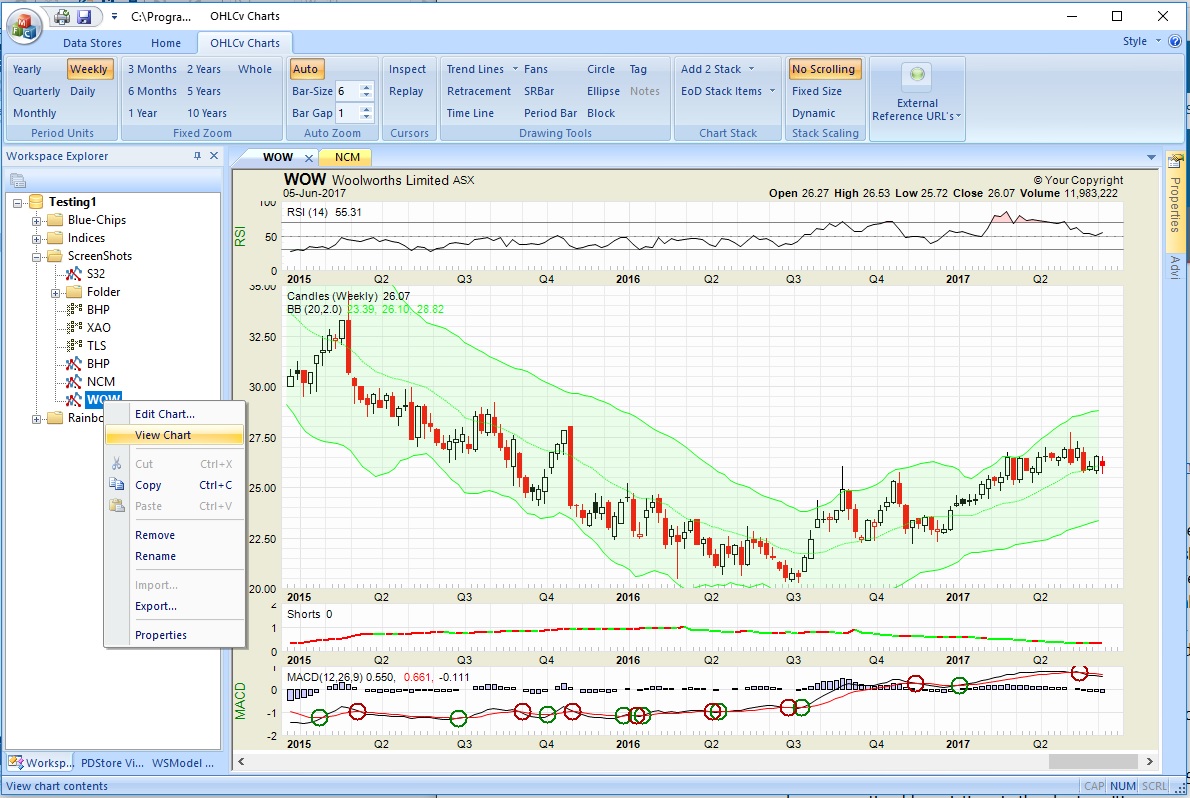
A weekly WOW chart with a Bollinger Band overlay, candlesticks, RSI, MACD and short-selling positions.
Weekly chart stackWeekly WOW chart showing a Bollinger Band overlay, RSI, candles, MACD and short-selling positions.
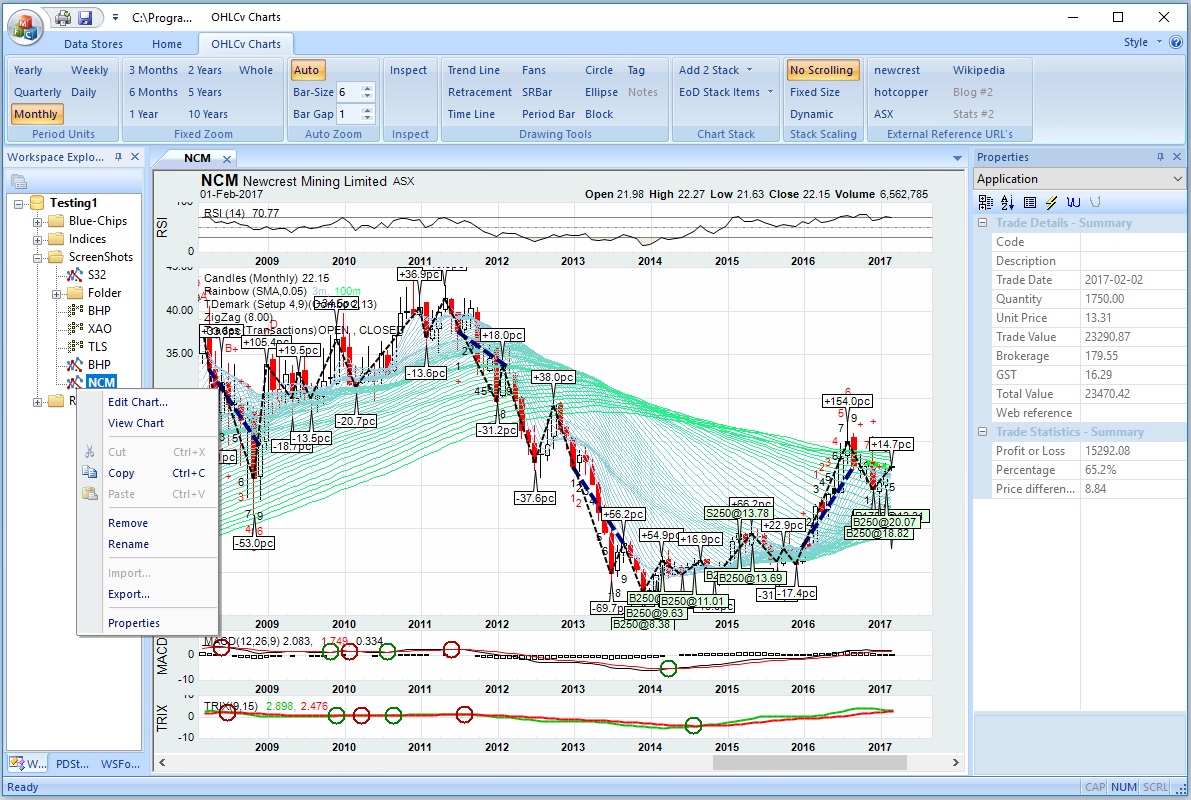
An ASX rainbow chart for NCM with annotated trading positions.
Rainbow chartASX rainbow chart for NCM with annotated trading positions.
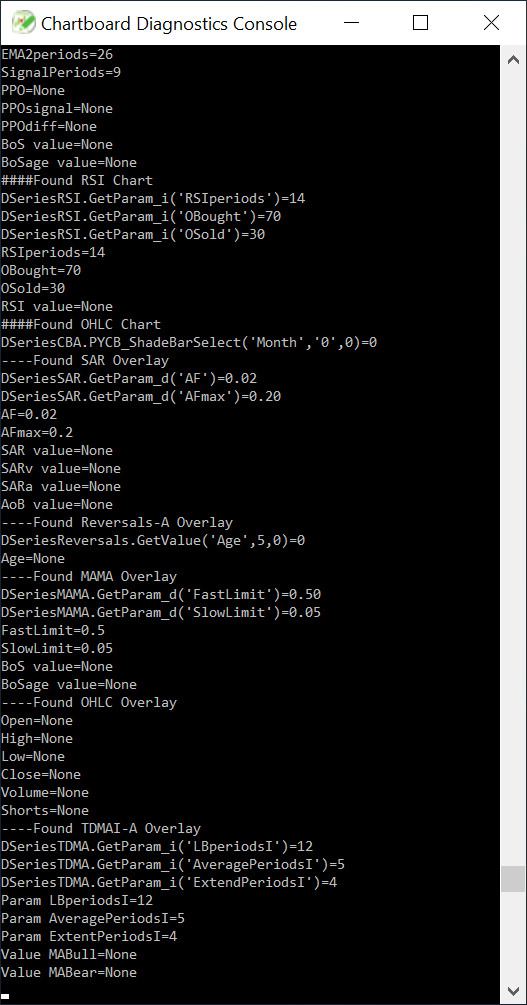
The Chartboard diagnostics console showing Python script output.
Diagnostics consolePython stdout and stderr redirected into the console for script development and debugging.
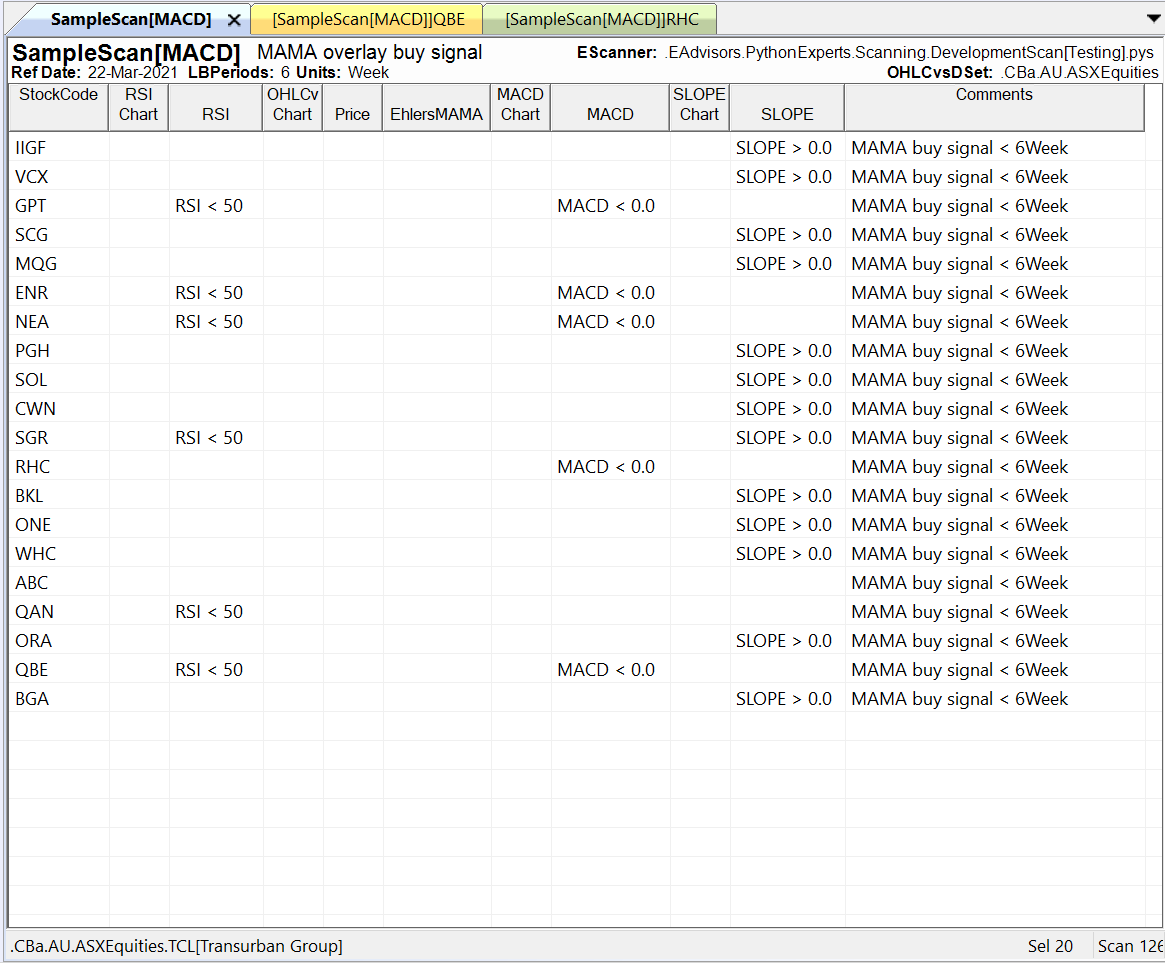
Scan results tabulated in a list control generated by a Python scanner script.
Scan resultsThe list control produced by a scanner script — double-click a row to generate that stock's chart.