Ivyware/Chartboard/Scanning
Scanning
Ask the whole market one question
A scan is a first-class workspace object, sitting in the explorer tree alongside your charts. Point a Python scanner script at it and Chartboard builds a synthetic chart for every stock so the script can interrogate ordinary chart visuals, then tabulates whatever comes back.
Scripting
- Scans are created and maintained in the Workspace Explorer tree, as per and alongside OHLCvs and Point & Figure charts. Scan definitions may be copy-pasted, exported and imported between Chartboard sites as simple
*.Msgraws#Scannerfiles, independently of the assigned Python script. - Scripts are based on the Python 3.11 release that ships with the product.
- Duplex interaction is provided by an extensive set of Python extension functions.
- Chartboard Extension Classes (CBEC) are available for developing proprietary scripts.
- Scanning scripts are disk files with the
.pysextension and may be exchanged as required. Advisor scripts use.pya; regular Python modules common to both usually keep the standard.pywextension. - A console window can be activated from inside Chartboard for monitoring and debugging.
- Python has duplex access back into Chartboard for data and visuals, and forward access into third-party products — SQL databases, AI and machine learning.
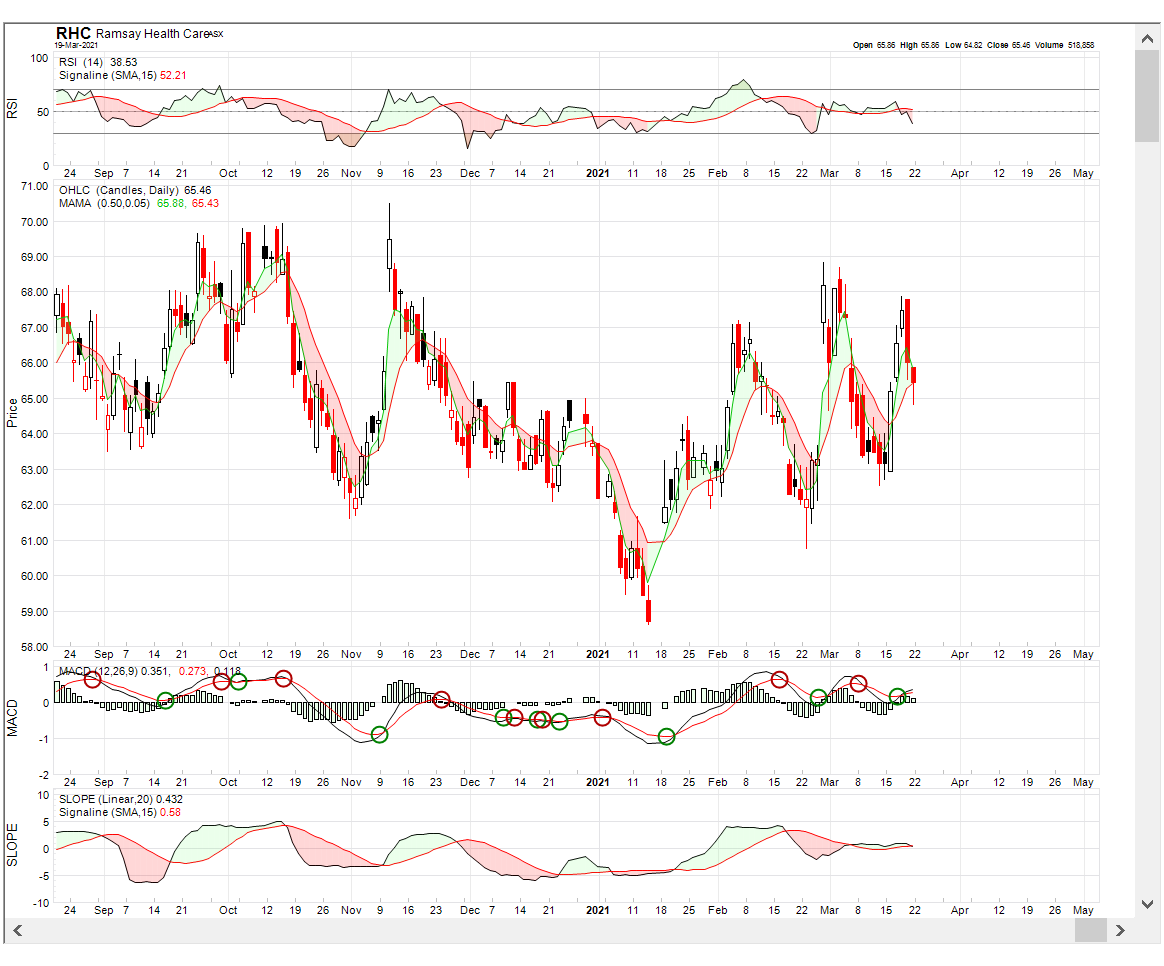
- Scripts generate a synthetic chart for each stock, through which standard visuals may be queried. Those charts can be viewed individually for selected stocks once the scan completes.
- Scanning scripts attach to scans as required. Chartboard supports multiple scan definitions, all serialised.
- Multiple scans may run concurrently — but only a single instance of any given scan.
Operation
Scan objects are managed through the Workspace Explorer tree:
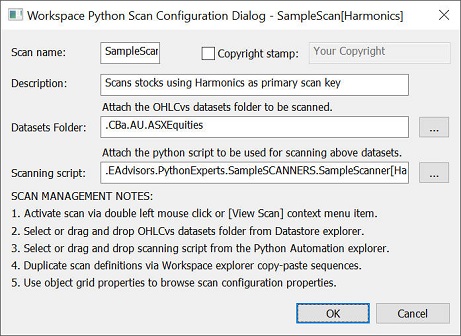
- From a workspace folder's context menu, select [New Stock Scanner…], which opens the scan configuration dialog.
- Activate the scan by double-clicking it, or through the [View Scan] context menu item.
- Use the displayed ribbon bar items to manage scan activity.
Chartboard Extension Classes
Scanning scripts are usually built on CBEC, which wraps the raw Chartboard Python scripting API. The extension classes ship with the product in PythonCBEC.pyw; alternatively the API can be used directly to build an equivalent library or extend the existing one.
Scanning and advisor scripts share the same extension classes, with one structural difference: scanning scripts access Chartboard through CScanner-generated descendant classes, while advisor scripts access it as CStack descendants. Both are managed through the Python Scripts Map attachment explorer. Scanner scripts may only run from scanning environments, and advisor scripts only from a chart stack environment.
If scripts will not run at all, check that Chartboard is not running elevated. It has no need for administrator privileges, and disables Python scripting entirely when it detects them. The other cause is the Python 3.11 runtime not being found — it ships with the installer, so this normally means a partial install.
Scripts execute with your privileges and can reach outside Chartboard, so accept .pya, .pys and .pyw files only from sources you trust.
Debugging
- Activate the application console and divert Python's
stderrandstdoutto it — Ribbon Bar → [Home] tab → [View] group → Console. If scripts are active on multiple charts, debug messages will interleave. - Scripts may be edited inside Chartboard or in a third-party editor.
- The {Python Debug} → Inspection cursor, moved over a chart stack, exposes the underlying data in Python scripting format.
- Property grids expose hints for the parameters reachable from automation scripts, in the Property Description region at the base of the grid.
Sample scanners
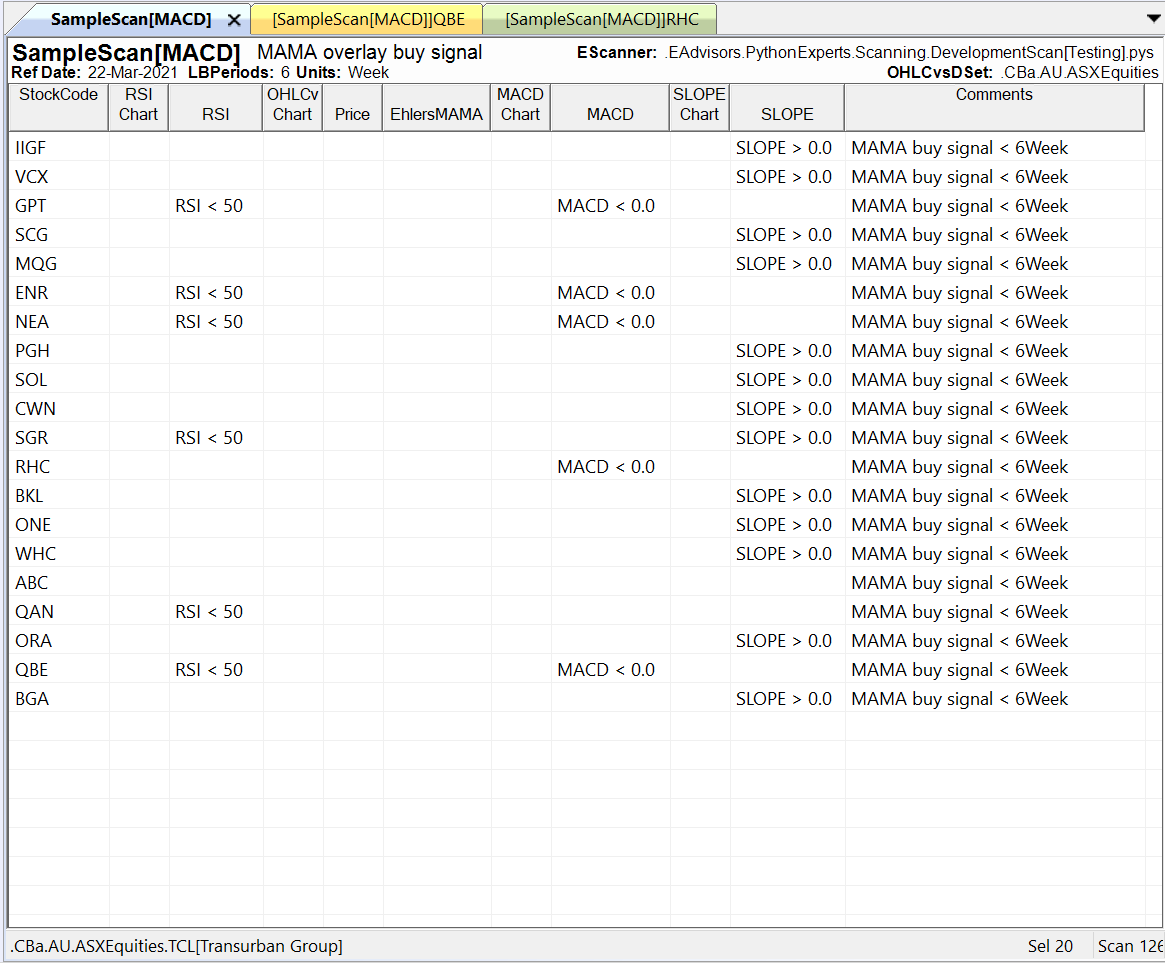
Each of these generates a list control summarising its results. A chart for any tabulated stock is generated automatically by double-clicking its row, or by selecting {View Scan Chart} from the row's context menu.
Scanner samples (.pys)
Selects stocks whose MACD buy signal occurred within a nominated number of periods and whose calculated MACD value is below zero.
Selects stocks whose last fitted reversal is bullish.
Selects stocks whose last fitted harmonic is bullish.