Ivyware/Chartboard/Modelling
Modelling
Trades you didn't take, drawn where you'd have taken them
Modelling is what happens when a strategy fires. Trades generated this way are annotated on the chart, aggregated in the properties grid, and held entirely separately from real portfolio positions — so a hypothesis never contaminates the record.
Scripted modelling
Chartboard supports advisor-modelling automation using custom Python scripts.
- Scripts are based on the Python 3.11 release.
- Modelling is performed through Python extension functions.
- Chartboard Extension Classes (CBEC) are available for developing custom scripts.
- Advisor-modelling scripts are Python files with the
.pyaextension and may be exchanged as required. Scanning scripts use.pys; regular modules common to both usually keep.pyw. - A console window can be activated from inside Chartboard for monitoring and debugging.
- Python has duplex access back into Chartboard for data and visuals, and forward access into third-party products such as SQL databases, AI and machine learning.
- Scripts may query chart visuals and adjust their processing and behaviour accordingly.
- Drawing and mark-up visuals may be controlled from scripts.
- When model trades are activated from a script, Chartboard is deemed to be in modelling mode — separate from portfolio trades.
- Advisor-modelling scripts attach to charts as required, and an assigned script may verify the chart's suitability when activated.
Scripts may be dragged and dropped onto charts from Windows File Explorer or from the internal Mapped Python Scripts Explorer. A LOCAL script is assigned individually to each chart and a GLOBAL script is common to all. Once assigned, they run from Ribbon Bar → [Python] tab on a per-chart basis.
Extension classes
Modelling scripts are usually based on CBEC, which wraps the raw Chartboard Python scripting API. These classes ship with the product in PythonCBEC.pyw; the API can equally be used to build an equivalent library or extend the existing one.
Advisor, modelling and scanner scripts share the same extension classes. The structural difference is that modelling scripts access Chartboard through CStack-generated descendant classes, while scanning scripts access it as CScanner descendants. Both are managed through the Python Scripts Map attachment explorer; scanner scripts may only run from scanning environments and modelling scripts only from a chart stack environment.
Manual modelling
Trades can also be modelled by hand:
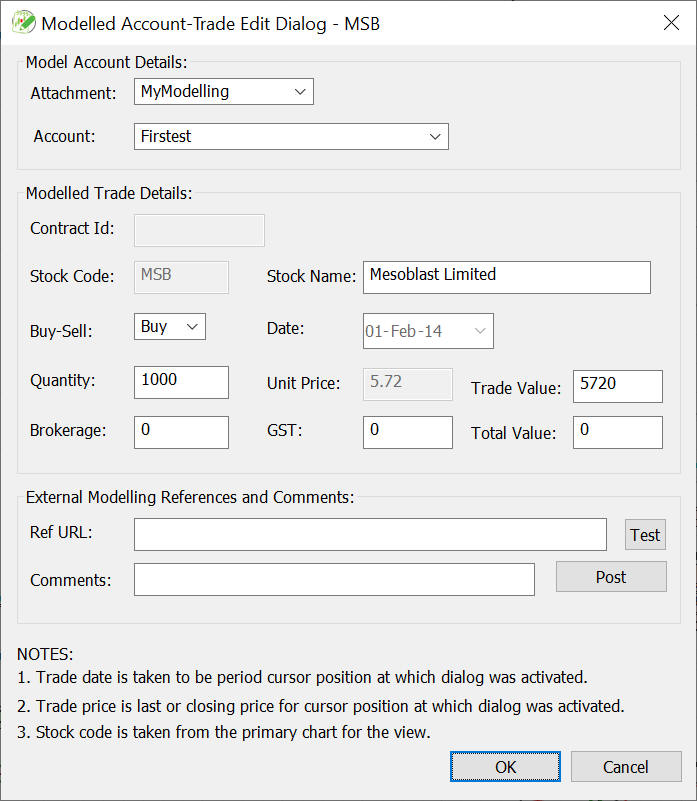
- From the context menu of any chart on which you want to model a trade, select the Modelling Trade item.
- Configure the modelled trade's details in the dialog presented.
- Display modelled trades on any chart in the stack via the Mark-ups → Modelling Positions… context menu item.
Modelled trades can be deleted manually from the Modelling Attachment explorer tree, by selecting Delete from the annotated trade's context menu, or with the ModelTrade.CleanupTrades() scripting utility.
If scripts will not run at all, check that Chartboard is not running elevated. It has no need for administrator privileges, and disables Python scripting entirely when it detects them. The other cause is the Python 3.11 runtime not being found — it ships with the installer, so this normally means a partial install.
Scripts execute with your privileges and can reach outside Chartboard, so accept .pya, .pys and .pyw files only from sources you trust.
Debugging
- Activate the Chartboard Diagnostics Console and divert Python's
stderrandstdoutto it — toggled via Ribbon Bar → [Home] tab → [View] group → Console. With scripts running on multiple charts, debug messages will interleave. - Scripts may be edited inside Chartboard or in an external editor.
- The {Python Debug} → Inspection cursor exposes the underlying chart-stack data in Python scripting format — useful as a guide to reaching data from Python, and for debugging.
- Property grids expose hints for parameters reachable from automation scripts, in the Property Description region at the base of the grid.
Sample
SampleModel[MACD].pya ships with the product. It performs trades where the MACD buy signal appears while the calculated MACD value is below zero, and the trades it generates can then be viewed as mark-ups.
Modelled positions are not portfolio positions. For real trades and dividend payments, see portfolio.